Debugging tools and tricks
Celery
Celery logging level
Launch celery in INFO log level:
$ bin/pcelery worker parts/instance/etc/zope.conf -l info
Debugging in Celery tasks
PDB cannot be used in Celery (it would raise a BdbQuit exception and die).
We can use rdb instead:
from celery.contrib import rdb
rdb.set_trace()
It will stop the task execution with a message like:
[2015-03-04 11:16:11,951: WARNING/Worker-2] Remote Debugger:6901: Please telnet into 127.0.0.1 6901.
Type `exit` in session to continue.
Remote Debugger:6901: Waiting for client...
We have to open a telnet session on the mentioned port to access the debugger:
$ telnet localhost 6901
See also debugging tests in the async documentation: Asynchronous Functionality
Zope profiler
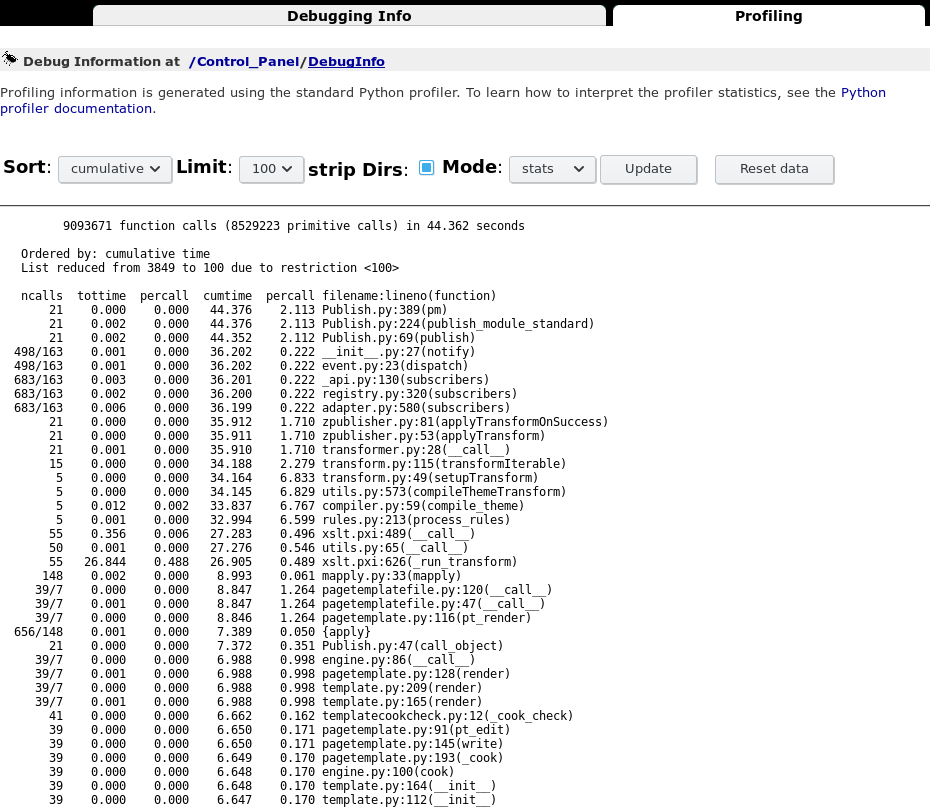
The ZMI contains a built-in performance profiler under ControlPanel / Debug Information.
Activating the profiler
To activate, add the following to your buildout.cfg:
[instance]
environment-vars +=
    PROFILE_PUBLISHER 1

zope-conf-additional +=
    publisher-profile-file ${buildout:directory}/var/profile.dat
Monkey required
If you try to access the debug information in the ZMI, this will break on:
Module App.ApplicationManager, line 171, in refcount
Module celery.five, line 314, in __getattr__
AttributeError: 'log' object has no attribute '__file__'
You can fix that by applying the following patch to class DebugManager in ApplicationManager.py:
*** /var/tmp/eggs/Zope2-2.13.24-py2.7.egg/App/ApplicationManager.py-orig    2017-02-15 18:49:50.143394084 +0000
--- /var/tmp/eggs/Zope2-2.13.24-py2.7.egg/App/ApplicationManager.py 2017-02-15 18:52:05.069003128 +0000
***************
*** 165,174 ****
          for m in sys.modules.values():
              if m is None:
                  continue
!             if 'six.' in m.__name__:
                  continue
              for sym in dir(m):
!                 ob = getattr(m, sym)
                  if type(ob) in t:
                      counts[ob] = sys.getrefcount(ob)
          pairs = []
--- 165,177 ----
          for m in sys.modules.values():
              if m is None:
                  continue
!             if 'six.' in repr(m):
                  continue
              for sym in dir(m):
!                 try:
!                     ob = getattr(m, sym)
!                 except AttributeError:
!                     continue
                  if type(ob) in t:
                      counts[ob] = sys.getrefcount(ob)
          pairs = []
Using the profiler
One way of using the profiler is to sort by cumulative time, then see if there are any suspicious time jumps at a specific call point. Typically you hit the site once after startup to warm all caches, then Reset data, then hit the site again to obtain call stats for a hit with warm caches.
In the profiler output below for example it is immediately obvious the Diazo transforms are not cached and eat an inordinate amount of CPU time.
